
Published on 11 November 2026 • Written by James Lawson
A guide to closing the software portfolio value creation gap and building a stronger operating partner playbook for PE-backed SaaS.
Private equity firms are exceptional at identifying undervalued software businesses. They are less consistent at unlocking the operational value they identified at investment, and that is the gap at the heart of every software portfolio value creation plan. Here is where the gap lives and why it is larger than most operating partners would freely admit.
I want to start with a number. Software businesses are being held for a long time. Private Equity Info's analysis of 13,757 completed PE exits puts the median hold for technology businesses (software, SaaS, data and tech-enabled services) at 5.6 years for 2025 exits, up from 4.5 years in 2021. For Europe, the Gain "State of European Private Equity" report puts the median company exiting in 2025 at 5.7 years in portfolio, up from 4.7 years in 2020. Across all buyouts, Bain's 2026 Global Private Equity Report puts the average holding period at exit at about seven years, up from five to six between 2010 and 2021.
Meanwhile, the average operational improvement delivered to the commercial engine of these businesses during the hold, measured in NRR improvement, CAC reduction and expansion revenue growth, is, in my experience, significantly below what was projected in the investment thesis. That is my observation from 41 software businesses, not a published benchmark, and I will be clear about that throughout.
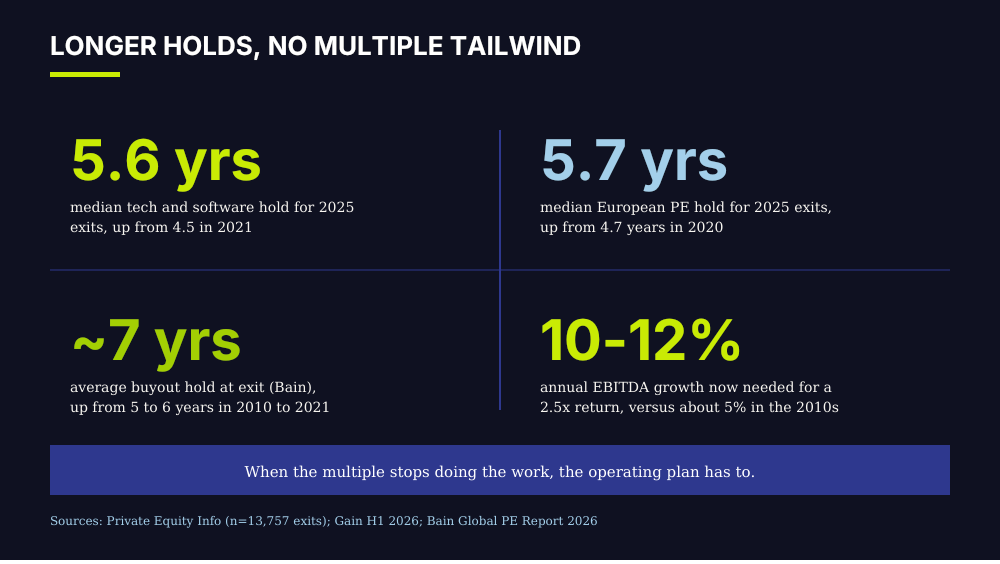
It is not a criticism of PE firms. It's an observation about where the friction lives between investment logic and operating reality. And it matters more than it used to. Bain says the tailwind of rising multiples that flattered the 2010s has gone, and that required EBITDA growth to reach a 2.5x return over five years has roughly doubled, from about 5% a year to 10% to 12%. Its conclusion is that returns now need "significantly more operational improvement and revenue growth". When the multiple stops doing the work, the operating plan has to.
The businesses that close the value creation gap, where operational improvement matches or exceeds what the investment committee believed was possible, exit at materially higher multiples than the ones that do not. How much higher varies with size, growth and retention, and I would not promise a fixed number. But the dispersion is real. In Software Equity Group's mid-2024 public SaaS data, companies with NRR above 120% traded at a median of 9.3x revenue and those below 100% at 3.1x, a threefold gap driven largely by the commercial engine. In my experience with private deals, the spread between a business that delivered its plan and one that did not has often been in the range of two to four times.
So where is the gap, and why does it keep showing up?
The operating partner bandwidth problem in portfolio company operations
The most consistent structural challenge I observe in PE-backed software portfolios is bandwidth. Operating partners at most European PE firms are responsible for five, eight, sometimes twelve portfolio companies simultaneously. Each of those businesses has a management team, a board, a set of commercial challenges and a value-creation plan that was designed with a level of operating partner involvement that is, in practice, impossible to deliver. More than likely a consultancy was brought in, preached a method used on many others, and left without real adherence locked in to the execution.
I have no published benchmark for operating partner coverage that matches what I see. The nearest data is dated: a Kearney study of PE operations teams found team members typically covering two to four portfolio companies under a generalist model and six to eight under a functional model, and only a third of the 26 CEOs surveyed said their PE owner provided a clear KPI structure (10% at underperforming companies). It is a 2014 study with a small sample, so treat it as directional.
The more recent signal is about measurement. A Wakefield Research survey for Maestro of senior PE professionals found that 52% of operating partners either don't use data-driven approaches to measure their operational efforts or don't measure them at all, and 62% found it difficult to demonstrate tangible outcomes. That was published in 2021, the sample size is not stated, and the sponsor sells measurement software, so weigh it accordingly.
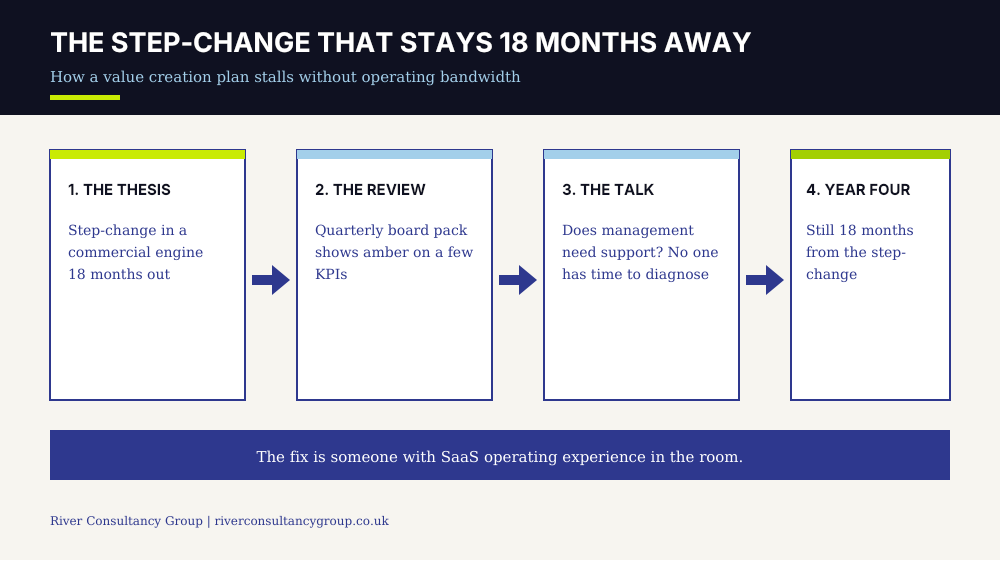
The result is a specific failure mode: the value-creation plan sits in a board presentation, gets reviewed quarterly, shows amber on a few KPIs and generates a conversation about whether the management team needs support. Six months later, the same conversation happens. The support never quite arrives in the form the business needs, because the operating partner does not have the time to diagnose the problem at the operational level where it lives.
"The investment thesis described a business that was 18 months away from a step-change in commercial performance. Three years later, the step-change is still 18 months away. This is the most expensive pattern in PE software investing."
The five operational gaps that most consistently destroy portfolio company value
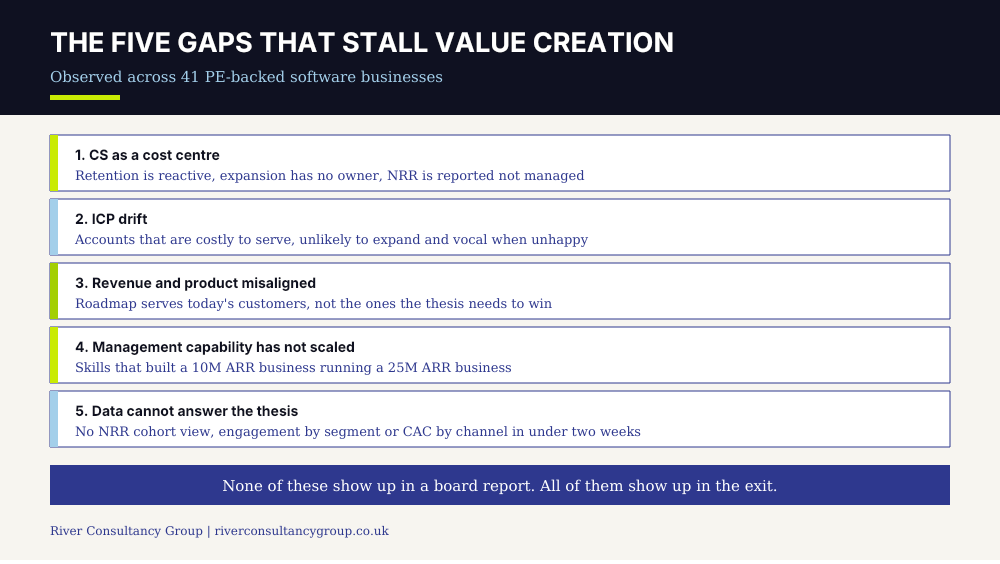
Across the 41 software businesses I have worked with (not a huge number, but enough for a working data set), the operational gaps that most consistently prevent value-creation plans from being delivered are these.
Customer success operating as a cost centre rather than a commercial motion. Retention is managed reactively. Expansion revenue has no dedicated owner. NRR is reported rather than actively managed. It is an ancient setup and a notorious cash drain. Benchmarkit's 2025 data shows why it matters: median NRR is 101% and expansion now delivers a median 40% of new ARR, at about half the acquisition cost of new customer ARR.
ICP drift. The business has been selling to anyone who will buy for long enough that the customer base now includes a significant proportion of accounts that are expensive to serve, unlikely to expand and highly vocal when unhappy. ICP adherence is the other half of the gap: you may have a lovely ICP, but is the firm aligned to it? Do they believe it's right?
Revenue and product functions that are not aligned. The product roadmap is being built for the customers the business already has rather than the customers the investment thesis requires it to win.
A management team whose commercial capability has not scaled with the business. The people who built a £10M ARR business are being asked to run a £25M ARR business with the same skills, the same processes and the same instincts.
Data infrastructure that cannot answer the questions the investment thesis requires. If you cannot produce a reliable NRR cohort analysis, a product engagement breakdown by customer segment, or a CAC trend by channel in under two weeks, your commercial decision-making is based on intuition rather than evidence. EY's 2026 exit readiness study found data and KPI readiness is still the top finance-function challenge in exit preparation, cited by 60% of GPs, and that companies often lack the customer or segment-level data to support their equity story.
The scale of the prize from fixing commercial execution is documented, if dated. Bain's commercial excellence work for PE portfolios reports 10% to 20% top-line acceleration and 10% to 15% EBITDA uplift in B2B settings when several commercial capabilities are targeted together. That figure is from Bain's 2018 report and does not state a sample size, so it is a statement of what is possible, not a forecast.
Why the value creation gap is larger in software than in other sectors
Software businesses are uniquely difficult to operate at a distance, because the value is intangible and the risk is often invisible. In a manufacturing business, operational problems show up physically: inventory builds, delivery times extend, quality metrics degrade.
In a SaaS business, the equivalent problems are happening inside customer relationships, inside product usage data and inside the commercial conversations that your CS team is or is not having with your highest-risk accounts. None of that is visible from a board report. This is why the most effective PE software investors have moved towards a model where operational support is more frequent, more diagnostic and more embedded in the day-to-day commercial reality of the portfolio company.
The pressure to do so is rising. Bain counts about 32,000 unsold companies worth $3.8 trillion across the industry, and almost 40% of portfolio companies are now held for more than five years, up from 29% in 2019. The 2020 to 2021 vintage of software deals, bought at peak multiples, is where the exit problem is hardest. For those assets, there is no multiple to rely on. The plan has to be delivered.
What closing the software portfolio value creation gap looks like
The businesses in PE portfolios that consistently deliver on their value-creation plans share a common operational characteristic: there is someone with genuine SaaS operating experience who is close enough to the commercial engine to see what is actually happening and who has the credibility with the management team to be heard when they describe what they see.
In every single one of the cases I've witnessed, the businesses that are still 18 months from their step-change at year four of the hold period are the ones where that person was never in the room.
The question worth asking before the next board meeting
If you are an operating partner reading this, here is the diagnostic I would suggest: pick the portfolio company in your software portfolio where the commercial performance has most consistently underdelivered against plan. Ask yourself honestly, do you know, at an operational level, why?
If you can answer that question with confidence, you do not need outside help. If you cannot, or if the honest answer is that you have not had the bandwidth to get close enough to find out, that is exactly the value creation gap this post is about.
If you would like to talk more about how we can help you audit your software portfolio, close the value creation gap and develop that 100 day plan, or turn the board vision into an operational reality, please reach out to me at jameslawson@riverconsultancygroup.co.uk or my partner Denny at denny.burda@riverconsultancygroup.co.uk, or explore more at riverconsultancygroup.co.uk.
James Lawson is founder of River Consultancy Group, a specialist advisory practice helping PE-backed SaaS businesses identify and unlock growth. He has scaled post-acquisition CS functions from 6 to 63 people and managed a $140M ARR portfolio across global law firms. Connect: linkedin.com/in/jlaw-maketheboatgofaster
Sources referenced:
Bain & Company, Global Private Equity Report 2026 (press release)
Private Equity Info, PE Hold Periods by Industry (13,757 exits, September 2026)
SaaStr, The PE Software Backlog (citing Bain, WSJ and PitchBook, July 2026)
Bain & Company, How Commercial Excellence Jump-Starts Growth in PE (2018, no sample stated)
Kearney, How Private Equity Operations Teams Create Value (2014, n=26 CEOs)
Maestro / Wakefield Research, survey of PE operating partners (2021, sample not stated)
Software Equity Group, SaaS Index (2Q24 NRR multiples; public companies)
